Navori Labs offers a tool that lets you display your business dashboards, making it easy to visualize key performance indicators (KPIs). By using this tool, you can keep an eye on important metrics like sales, customer behavior, and other critical data. It helps you understand how your business is performing and identify areas that need improvement, so you can keep growing.
Navori supports integration with various data sources including sales and CRM systems, financial software, ERP, social media, marketing platforms, external market research, and employee performance systems. This means you can gather comprehensive insights from across your organization.
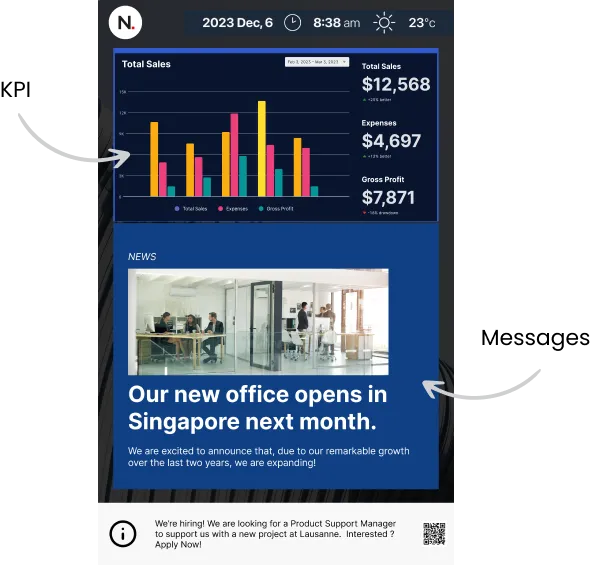

KPI Dashboard Features
Customize your Dashboards
Design your business dashboard with Navori’s customizable widgets, charts, graphs, and gauges to present the necessary KPIs, metrics and insights in an eye-catching way.
Discover Navori's Content Manager
Real-Time Data Visualization
Track business changes in real-time with Navori Business Dashboards. Get immediate insights into sales trends, customer behavior, and marketing success. Stay agile by monitoring essential metrics as they happen.
Discover Live Data
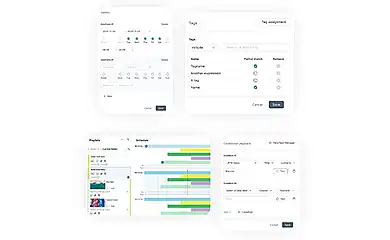
Automate Content When Meeting KPIs
Automatically trigger congratulatory messages and content when teams reach KPI targets to celebrate achievements and motivate continued success.
Discover Content Automation
Integrate Any Data Source, With No Code
Easily connect to any data source using Navori’s connectors, from Power BI and Workplace to Engage. You can create your connectors or request a custom one made by Navori Labs, all without needing to code.
Discover Navori's Designer in 4 Easy Steps
Navori’s KPI dashboards streamline the data analysis process, making tracking and responding to business metrics easy.


Data Integration
Use Navori’s Data Feed Manager to integrate your data sources and view comprehensive data on sales figures, customer traffic, staff performance metrics, and more.

Dashboard Setup
Create your KPI dashboards with Navori’s designer tool to track sales, transaction value, and customer satisfaction.

Real-Time Monitoring
Real-time data will continuously update on your dashboards once they are set up. This allows you to monitor different parts of your business and quickly gain insights into their performance.

Decision Making
Quickly make informed decisions with real-time data insights. Proactively identify trends and optimize operations to enhance performance.
Find Out More About KPI Dashboards
Learn how KPI dashboards can enhance your digital signage


Proactive Decision-Making
Real-time metric monitoring helps businesses stay ahead. Swiftly address challenges and capitalize on opportunities for better outcomes and competitiveness.


Get Real-Time Insights
Business dashboards are displayed in accessible areas for quick data understanding, enabling informed decisions without analysis or system access.
Tracking Performance and Accountability
Navori integrates real-time data to keep digital signage up-to-date. Employees can track performance, monitor progress, and respond to changing business needs.


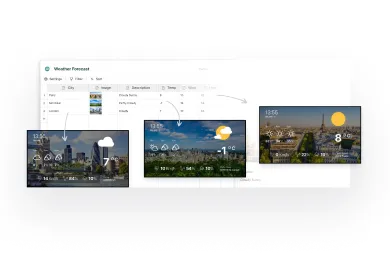
Display Dashboards on Any Screen Regardless of Brand or Orientation
Navori software makes dashboards accessible to all employees, regardless of screen type, brand, orientation, or resolution.
Corporate Dashboards
Navori integrates with Power BI to create dynamic corporate dashboards to showcase real-time performance metrics, financial summaries, and operational insights directly on digital signage. It benefits corporate settings where informed decision-making and transparency are essential, allowing employees and management to stay updated with the latest business analytics at a glance.
")
Lookup your data, Display Only Relevant Information
Navori software customizes data lookups for digital signage, displaying relevant information to boost efficiency and focus.

Trigger Content Based on Live Data and Set Rules
Navori software combines live data from multiple sources into one dashboard, giving organizations a complete view of their operations. The data, from CRM systems, financial software, social media, etc., is displayed on digital signage for easy access and analysis.

Create your Own KPI Dashboard in Minutes!
A user-friendly interface enables businesses to create KPI dashboards without technical knowledge, tailored to specific organizational needs and goals.
